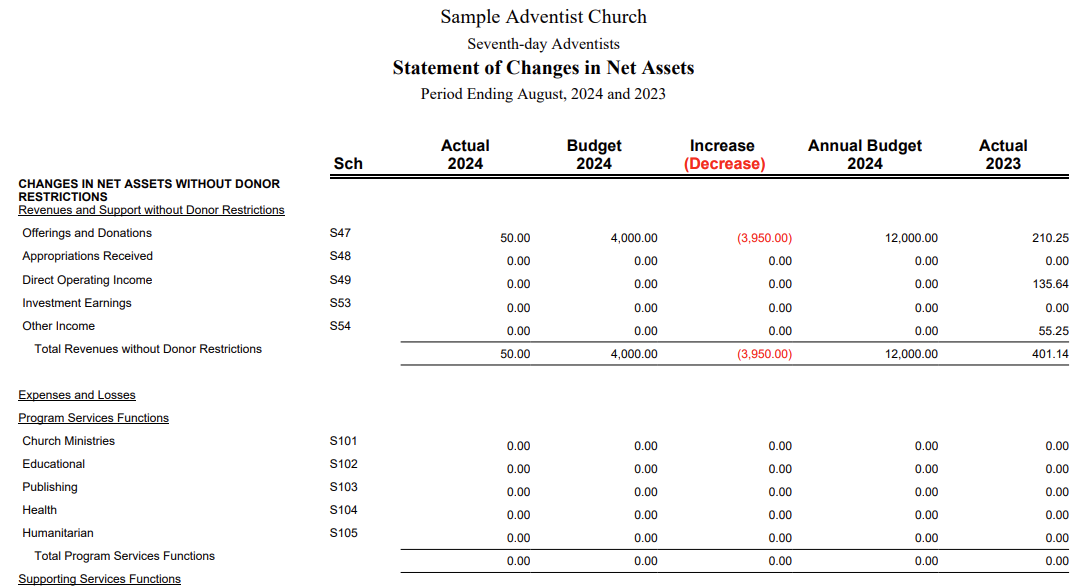
In the Statement of Changes in Net Assets Report, also known as the Income Statement, you can run a report for a YTD summary of the income, expense, and change in net assets of the organization through the report period selected.
The report screen will display a message that “Statement of Changes in Net Assets is ready to be run.”
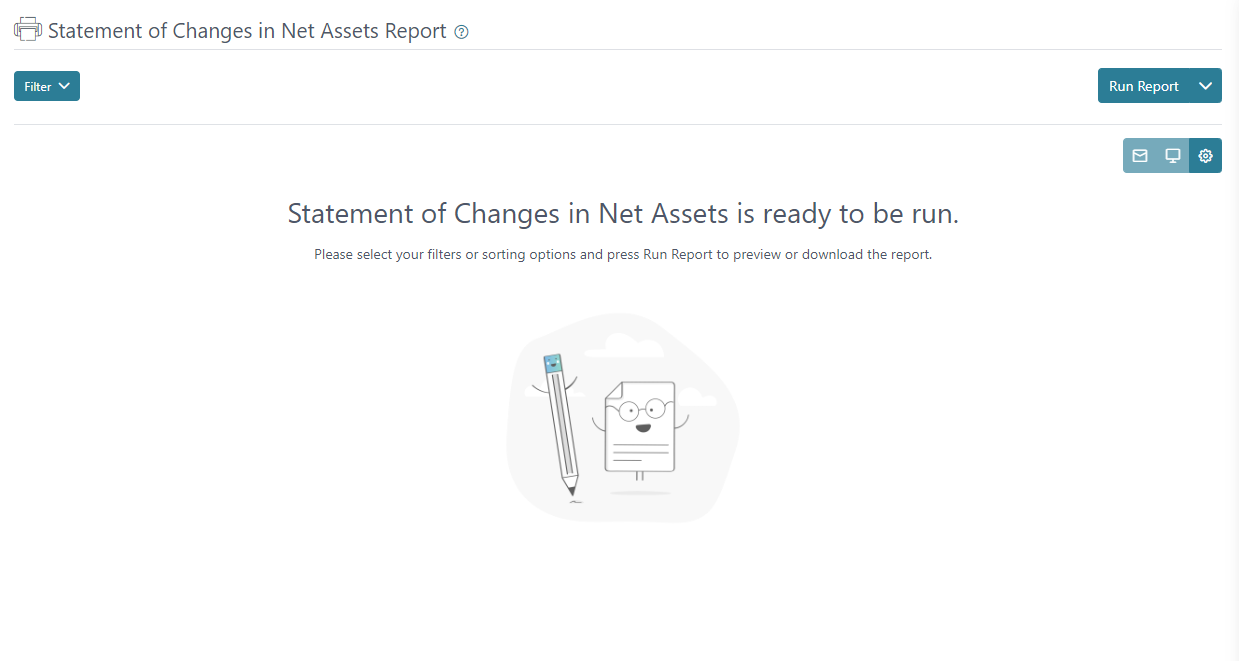
You click on “Run Report” and the report will generate based on the default filter settings.

In the filter menu, you can set a Period selection. The clear button will remove any recent selection made in the filter fields and the apply button will run the report including any changes made to the filter.

The report has three generating options.

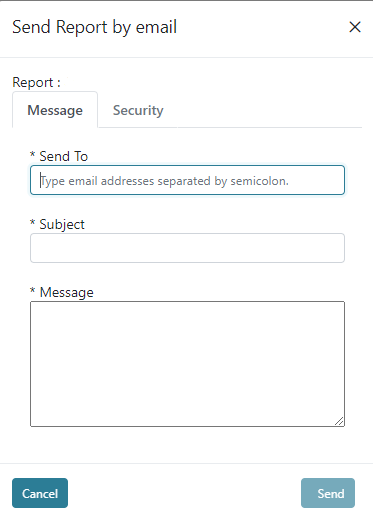
The envelope icon can be used to send the report by email.
The laptop icon can be used to open the report in a new tab or window depending on your browsers settings.

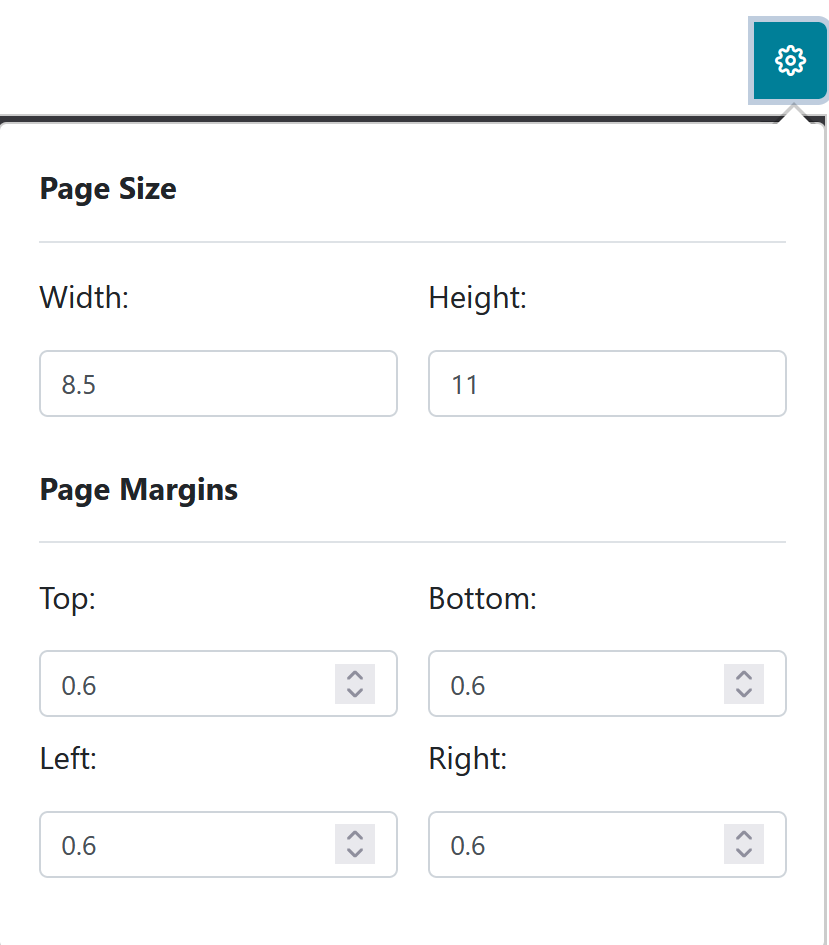
The gear icon can be used to set up page size and margin configurations for the report.