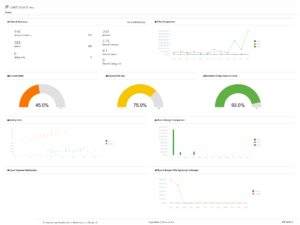
The Church Treasury System Dashboard is designed to provide a quick snapshot of the current health of your church.
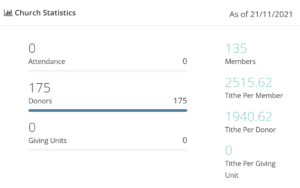
There are a number of helpful statistics such as members, attendance, donors, and giving units, along with Tithe Per Member, Tithe Per Donor, & Tithe Per Giving Unit.
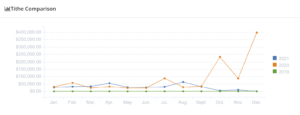
A Tithe Comparison is provided for the current year and the two years prior.
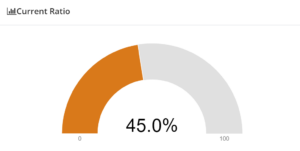
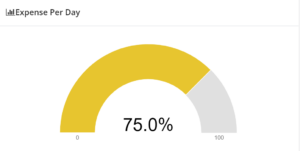
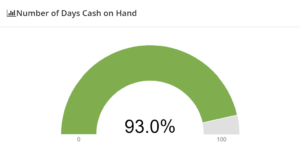
A number of key financial indicators are also provided such as the Current Ratio, Expense Per Day, and Number of Days Cash on Hand.
The current ratio is a liquidity ratio that measures whether a church has enough resources to meet its short-term obligations. It compares a churches current assets to its current liabilities, and is expressed as follows: Current Ratio = Current Assets / Current Liabilities. The current ratio is an indication of a churches liquidity.
The expense per day is the average daily church expenses. It compares how much the church is spending daily and is expressed as follows: Expense Per Day = Total Expense / Number of Days and is expressed based on the expense and number of days in a selected period. This is an indication of how much the church is spending each day.
The number of days cash on hand is the number of days that a church can continue to pay its operating expenses, given the amount of cash available. It compares a churches cash on hand to its expense per day, and is expressed as follows: Number of Days Cash on Hand = Cash & Cash Equivalents / Expense Per Day.
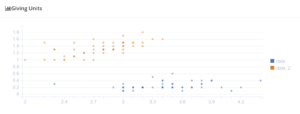
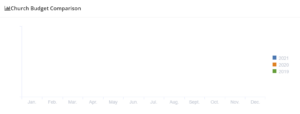
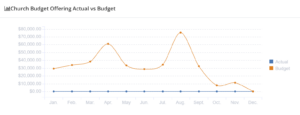
There are also a number of graphs provided as a helpful reference including Total Giving Units over time, a Church Budget Comparison, Local Expense Distribution, and Church Budget Offerings Actual vs Budget.

The dashboard can be printed on a single page preview using a scale of 50% and will be optimized for this simplified way to present the key items for the organization.